Lane Detection with OpenCV using Hough Transform
Published
· 2 years ago
computer visionopencvpythonhough transformimage processing
We are going to use OpenCV to detect lanes and lane changes in a dashcam video.
The code for this project is available on GitHub, and the result can be seen on Youtube.
The code for this project is available on GitHub, and the result can be seen on Youtube.
Setup
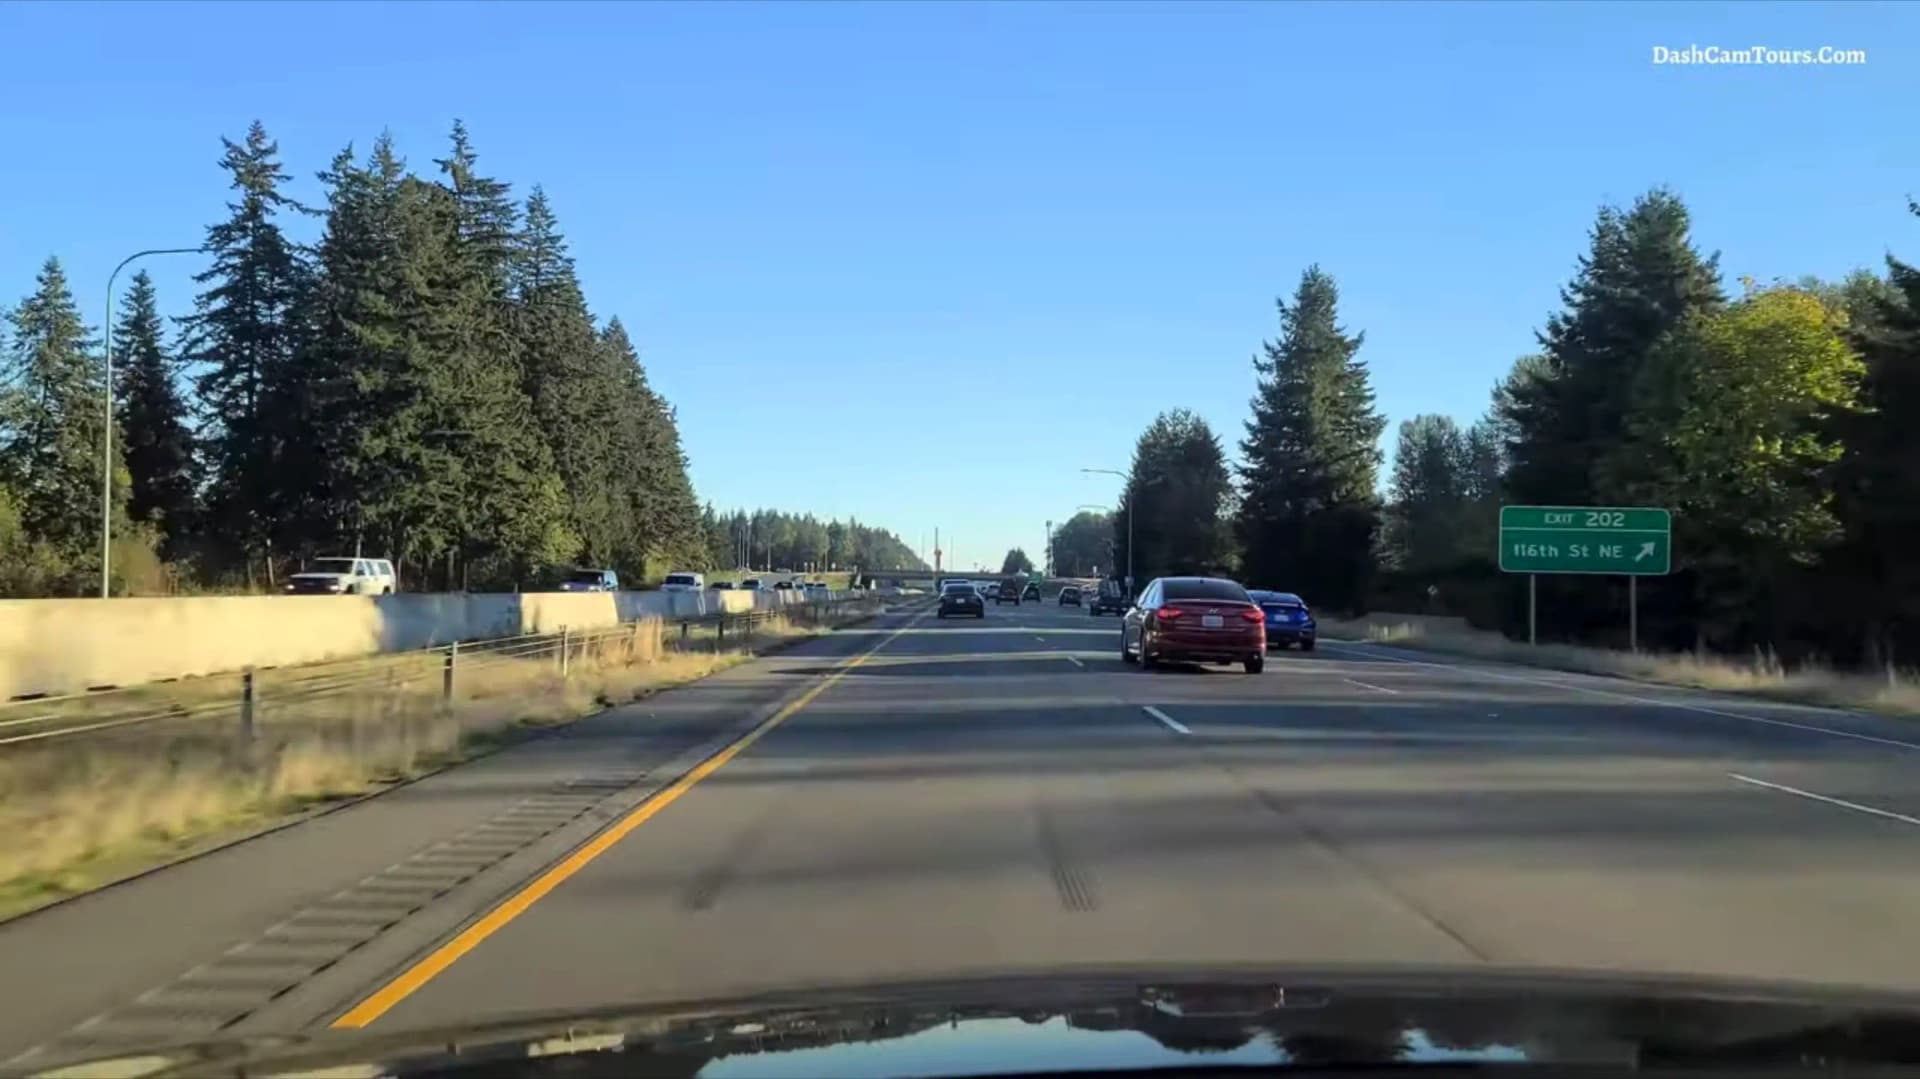
First, we need a dashcam video to work with. I chose this one because it features multiple lane changes, both left and right. A frame from the video looks like this:
Let's import the necessary libraries,
cv2cv2 for OpenCV and numpynumpy for working with arrays:import cv2
import numpy as npimport cv2
import numpy as npWe're going to need to extract frames from our video and write them to an output video.
We can do this using the
We can do this using the
VideoCaptureVideoCapture and VideoWriterVideoWriter classes from OpenCV:def LaneDetect(input, output="output"):
# create video capture object
video = cv2.VideoCapture(input)
# get video dimensions and framerate
video_width = int(video.get(3))
video_height = int(video.get(4))
video_fps = video.get(cv2.CAP_PROP_FPS)
# create video writer object
writer = cv2.VideoWriter(
output + '.mp4',
cv2.VideoWriter_fourcc(*'mp4v'),
video_fps,
(video_width, video_height))def LaneDetect(input, output="output"):
# create video capture object
video = cv2.VideoCapture(input)
# get video dimensions and framerate
video_width = int(video.get(3))
video_height = int(video.get(4))
video_fps = video.get(cv2.CAP_PROP_FPS)
# create video writer object
writer = cv2.VideoWriter(
output + '.mp4',
cv2.VideoWriter_fourcc(*'mp4v'),
video_fps,
(video_width, video_height))This creates a capture object that we can use to read frames from the video, and a writer object that we can use to write frames to the output video.
We want the output video to have the same framerate and dimensions as the input video, so we use the
We want the output video to have the same framerate and dimensions as the input video, so we use the
getget method to get those values from the capture object and pass them to the writer object.Now we can loop through the frames of the video, mess around with them, and write them to the output video:
success = True
while success:
    # read frame
    success, frame = video.read()

    # check if frame was read successfully
    if not success:
        break

    # do stuff with frame
    # ...

    # write frame to output video
    writer.write(frame)
success = True
while success:
# read frame
success, frame = video.read()
# check if frame was read successfully
if not success:
break
# do stuff with frame
# ...
# write frame to output video
writer.write(frame)Preprocessing
To detect the lanes, we are going to use the Hough Transform, which is a technique for detecting lines in an image. Before using the Hough Transform, it is necessary to preprocess the image.
Here is our preprocessing code:
Here is our preprocessing code:
def preprocess(im):
    # make a copy of the image
    res = im.copy()
    # convert to grayscale
    res = cv2.cvtColor(res, cv2.COLOR_BGR2GRAY)
    # apply color correction
    res = cv2.convertScaleAbs(res, alpha=1.5, beta=10)
    # apply gaussian blur to smooth out noise
    res = cv2.GaussianBlur(res, (5, 5), 0)
    # find edges using canny edge detection
    res = cv2.Canny(res, 50, 100)
    # isolate the region of interest
    trapezoid = np.array(
        [[(0, 1850), (1350, 1150), (1750, 1150), (3360, 1850)]])
    mask = cv2.fillPoly(np.zeros_like(res), trapezoid, 255)
    res = cv2.bitwise_and(res, mask)

    return res
def preprocess(im):
# make a copy of the image
res = im.copy()
# convert to grayscale
res = cv2.cvtColor(res, cv2.COLOR_BGR2GRAY)
# apply color correction
res = cv2.convertScaleAbs(res, alpha=1.5, beta=10)
# apply gaussian blur to smooth out noise
res = cv2.GaussianBlur(res, (5, 5), 0)
# find edges using canny edge detection
res = cv2.Canny(res, 50, 100)
# isolate the region of interest
trapezoid = np.array(
[[(0, 1850), (1350, 1150), (1750, 1150), (3360, 1850)]])
mask = cv2.fillPoly(np.zeros_like(res), trapezoid, 255)
res = cv2.bitwise_and(res, mask)
return resLet's break this down:
- Convert to grayscale: We don't really need the color information of the image. Converting to grayscale reduces the dimensions of the image from 3 to 1 and makes it easier to work with.
- Apply color correction: This is done to make the lines stand out more.
- Apply gaussian blur: This is done to smooth out noise in the image.
- Find edges: We use the Canny edge detection algorithm to find the edges of the lane markings. More information about Canny can be found here.
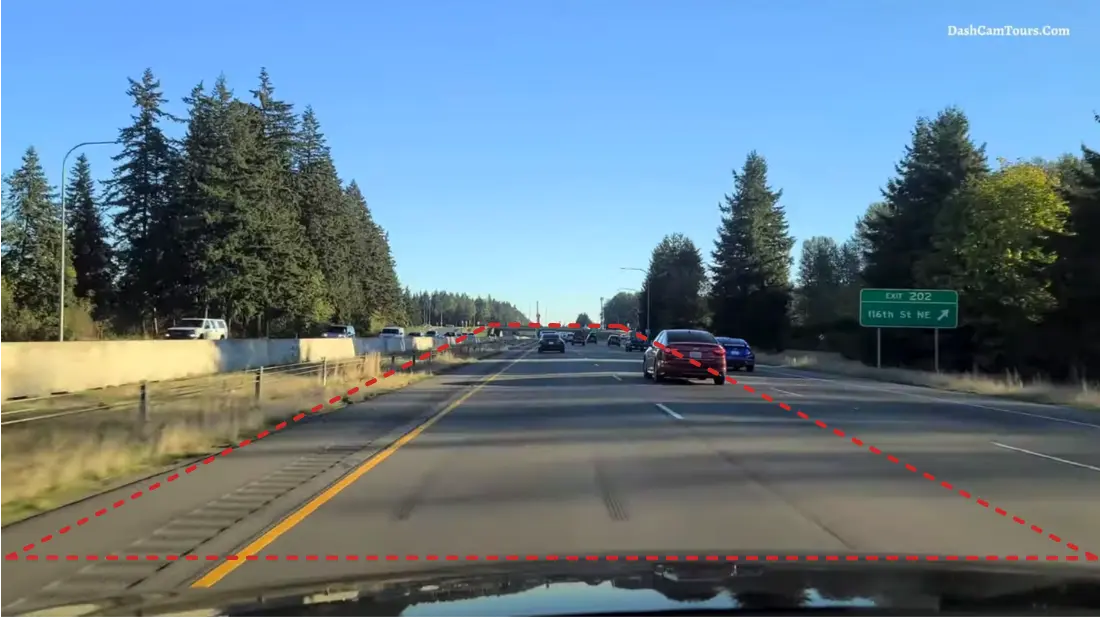
- Isolate: We know that the lane markings are always certain region of the image, so we can isolate this region. We do this by creating a trapezoid mask and applying it to the image.
Let’s see how our frame changes with each step:
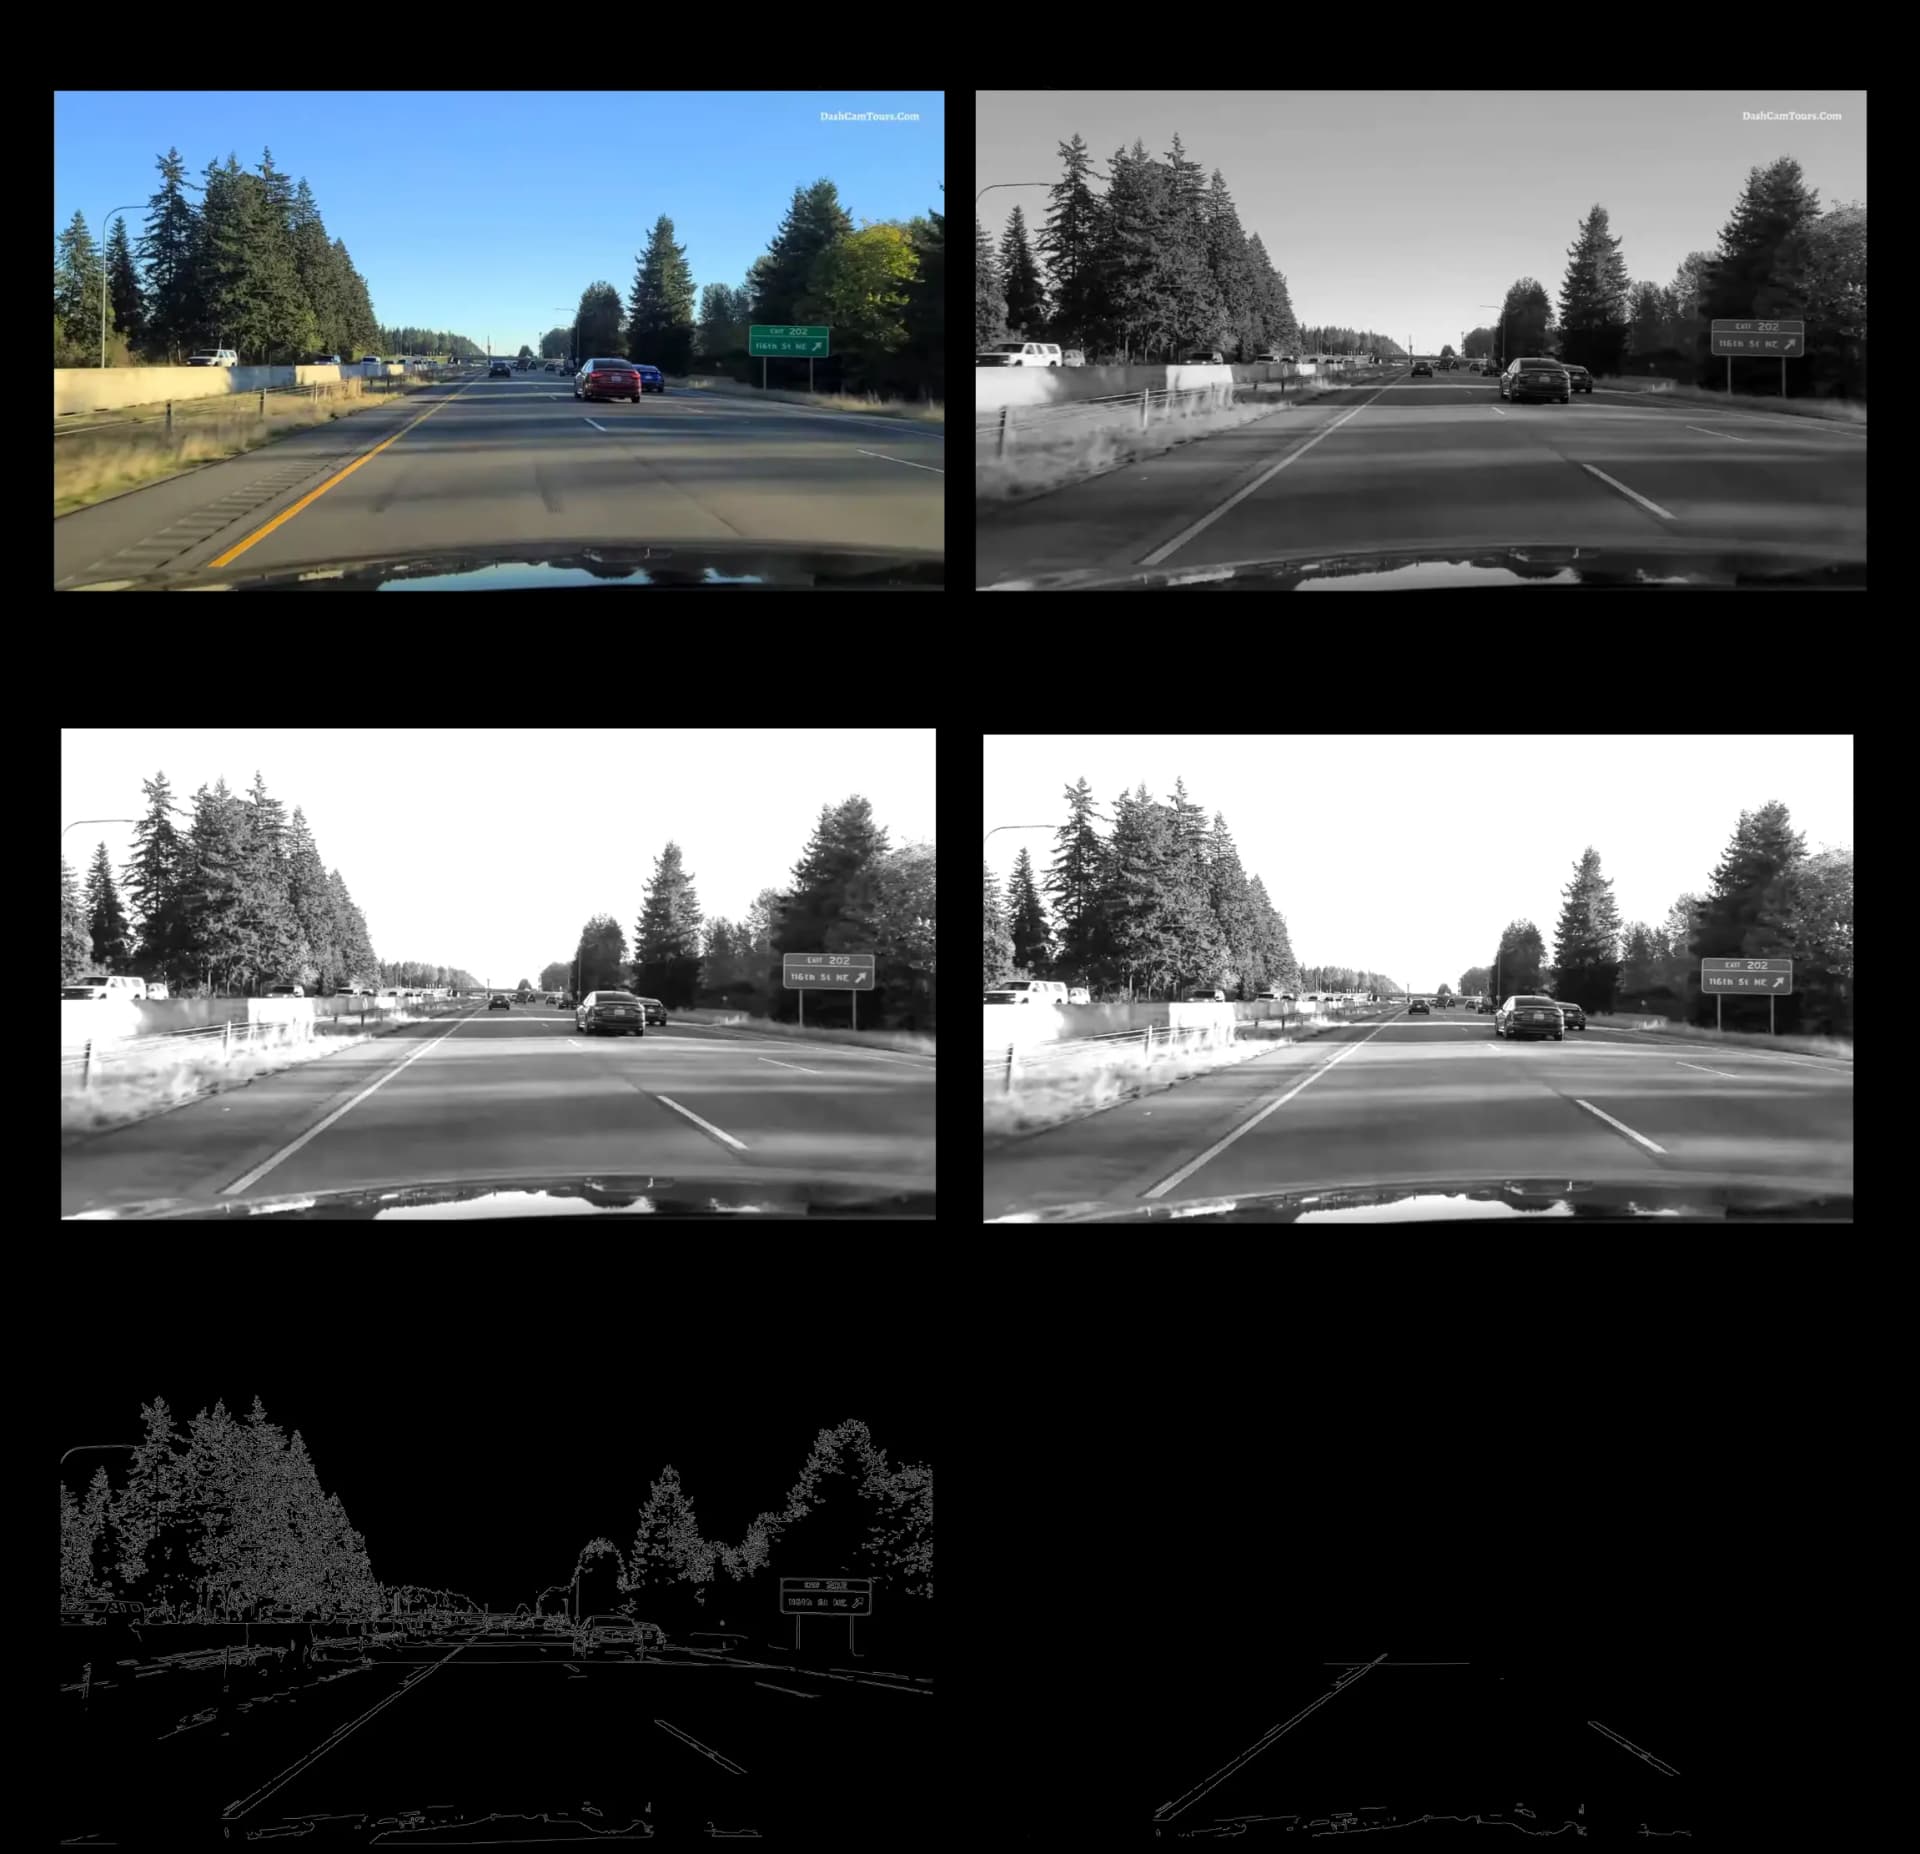
In the final step, we can see the edges of the lane markings. Now we can use the Hough Transform to extract their coordinates so we can draw them on the frame.
Hough Transform
Straight lines are typically represented using the cartesian coordinate system. In this system, a line is represented by the equation
Since we need the ability to detect vertical lines, we have to use a different system.
The Hough Transform uses the polar coordinate system to represent lines. In this system, a line is represented by the equation
y = mx + b, where m is the slope and b is the y-intercept.
However, this representation has one major drawback: vertical lines have an infinite slope, which means that they cannot be represented by this equation.Since we need the ability to detect vertical lines, we have to use a different system.
The Hough Transform uses the polar coordinate system to represent lines. In this system, a line is represented by the equation
ρ = xcosθ + ysinθ, where ρ is the distance from the origin and θ is the angle between the ρ line and the x-axis (measured in radians).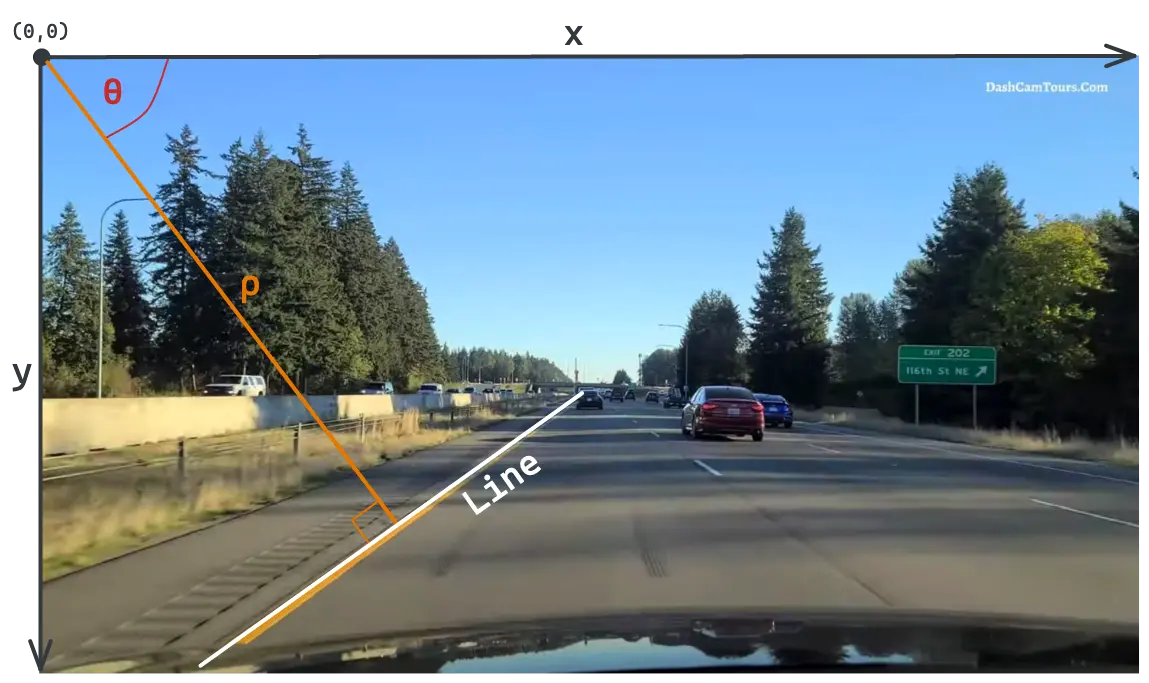
Note
In OpenCV, the origin (0,0) of the image sits at the top left, and not the bottom left as you might expect.
Left lane markings are either vertical or slanted to the right, so in this representation, their θ will be between
The lines with θ between
We can use this information and the
0 and 7π/18 radians (70 degrees). Right lane markings are either vertical or slanted to the left, so their θ will be between 11π/18 radians (110 degrees) and π radians (180 degrees).The lines with θ between
7π/18 and 11π/18 radians are horizontal lines, which are not lane markings and can be ignored.We can use this information and the
HoughLinesHoughLines function to find the left and right lines in the frame:left_lines = cv2.HoughLines(
preprocessed_frame, 1, np.pi/180, 100, max_theta=(7*np.pi)/18)
right_lines = cv2.HoughLines(
preprocessed_frame, 1, np.pi/180, 100, min_theta=(11*np.pi)/18)left_lines = cv2.HoughLines(
preprocessed_frame, 1, np.pi/180, 100, max_theta=(7*np.pi)/18)
right_lines = cv2.HoughLines(
preprocessed_frame, 1, np.pi/180, 100, min_theta=(11*np.pi)/18)We are using the following parameters:
rhorhois set to1- This is the resolution of theρparameter. The higher the value, the more accurate the lines will be, but the more lines will be detected.thetathetais set toπ/180(1 degree) - This is the resolution of theθparameter. The higher the value, the more accurate the lines will be, but the more lines will be detected.thresholdthresholdis set to100- This is the minimum number of pixels that need to be on a line for it to be detected.min_thetamin_thetaandmax_thetamax_theta- These are the minimum and maximum values ofθthat we want to detect.
The
HoughLines function returns a list of lines, each line is a 2d array, and the first element of that array is [ρ, θ].left_lines = [[[rho1, theta1]], [[rho2, theta2]], ... ]
line = left_lines[0] # first line
line[0][0] # rho of first line
line[0][1] # theta of first lineleft_lines = [[[rho1, theta1]], [[rho2, theta2]], ... ]
line = left_lines[0] # first line
line[0][0] # rho of first line
line[0][1] # theta of first lineChoosing the Best Lines
At this stage, we may have a long list of lines on each side, or we may have no lines at all.
If no lines are detected, we can use the previous frame’s lines. Since we know the car isn’t going to move a great distance between frames, the previous frame’s lines are a fairly good estimate – and better than nothing.
If no lines are detected, we can use the previous frame’s lines. Since we know the car isn’t going to move a great distance between frames, the previous frame’s lines are a fairly good estimate – and better than nothing.
if left_lines is None and len(prev_left_lines) > 0:
    left_lines = np.array([[prev_left_lines[-1][0]]])
# do the same for the right lines
if left_lines is None and len(prev_left_lines) > 0:
left_lines = np.array([[prev_left_lines[-1][0]]])
# do the same for the right linesIf we have a list of lines, we employ the following strategy to choose the best line on each side:
- We save the previous frame’s lines, and filter our lists to only include lines that are close to those. This helps removing outliers and makes the lines more stable between frames.
if len(prev_left_lines) > 0:
    close_left_lines = [line for line in left_lines if abs(
        line[0][0] - prev_left_lines[-1][0][0]) < 50 and abs(
            line[0][1] - prev_left_lines[-1][0][1]) < 0.1]
    if len(close_left_lines) > 0:
        left_lines = close_left_lines
# do the same for the right lines
if len(prev_left_lines) > 0:
close_left_lines = [line for line in left_lines if abs(
line[0][0] - prev_left_lines[-1][0][0]) < 50 and abs(
line[0][1] - prev_left_lines[-1][0][1]) < 0.1]
if len(close_left_lines) > 0:
left_lines = close_left_lines
# do the same for the right linesHere we are filtering the lines to only include lines with a
ρ value that is within 50 of the previous frame’s ρ value, and a θ value that is within 0.1 radians of the previous frame’s θ value. We only use this filtered list if it’s not empty.- We take the average of the lines. This leaves us with single
ρandθvalues for each side.
left_rho = np.average([line[0][0]
                    for line in left_lines]) if left_lines is not None else 0
left_theta = np.average([line[0][1]
                    for line in left_lines]) if left_lines is not None else 0
# do the same for the right lines
left_rho = np.average([line[0][0]
for line in left_lines]) if left_lines is not None else 0
left_theta = np.average([line[0][1]
for line in left_lines]) if left_lines is not None else 0
# do the same for the right linesMarking the Lanes
Now that we have a line on each side, we can start drawing them on the frame.
We don't want to draw the lines directly on the frame, because we want to control their opacity. We can do this by creating a new image to draw on, and then use the
We don't want to draw the lines directly on the frame, because we want to control their opacity. We can do this by creating a new image to draw on, and then use the
addWeightedaddWeighted function to add the new frame to the original frame with a specified opacity.lanes_image = np.zeros_like(frame)lanes_image = np.zeros_like(frame)This creates a new image that is the same size as the frame, but with all pixels set to black.
Before we can draw our lines, we need to convert them from polar coordinates to cartesian coordinates. We can do this using simple trigonometry:
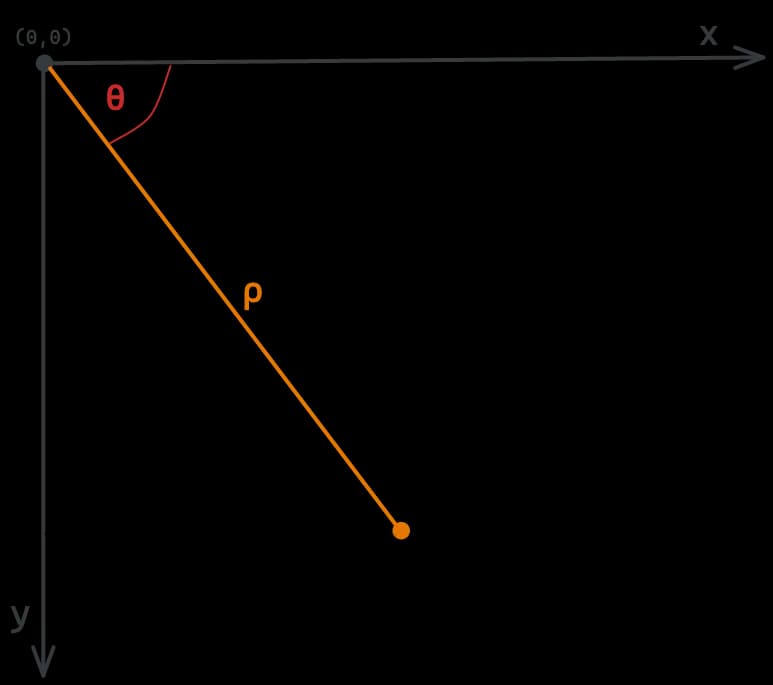
This gives us the coordinates of the line’s origin. We can then extend the line in both directions to cover the entire frame. In this case, we are extending the line 4000 pixels in each direction.
# calculate line coordinates from rho and theta
def get_points(rho, theta):
    a = np.cos(theta)
    b = np.sin(theta)
    x0 = a*rho
    y0 = b*rho
    x1 = int(x0 + 4000*(-b))
    y1 = int(y0 + 4000*(a))
    x2 = int(x0 - 4000*(-b))
    y2 = int(y0 - 4000*(a))

    return x1, y1, x2, y2

x1, y1, x2, y2 = get_points(left_rho, left_theta)
x3, y3, x4, y4 = get_points(right_rho, right_theta)
# calculate line coordinates from rho and theta
def get_points(rho, theta):
a = np.cos(theta)
b = np.sin(theta)
x0 = a*rho
y0 = b*rho
x1 = int(x0 + 4000*(-b))
y1 = int(y0 + 4000*(a))
x2 = int(x0 - 4000*(-b))
y2 = int(y0 - 4000*(a))
return x1, y1, x2, y2
x1, y1, x2, y2 = get_points(left_rho, left_theta)
x3, y3, x4, y4 = get_points(right_rho, right_theta)If we were to draw the lines now, they would extend too far and go beyond the road. Here's what it would look like:
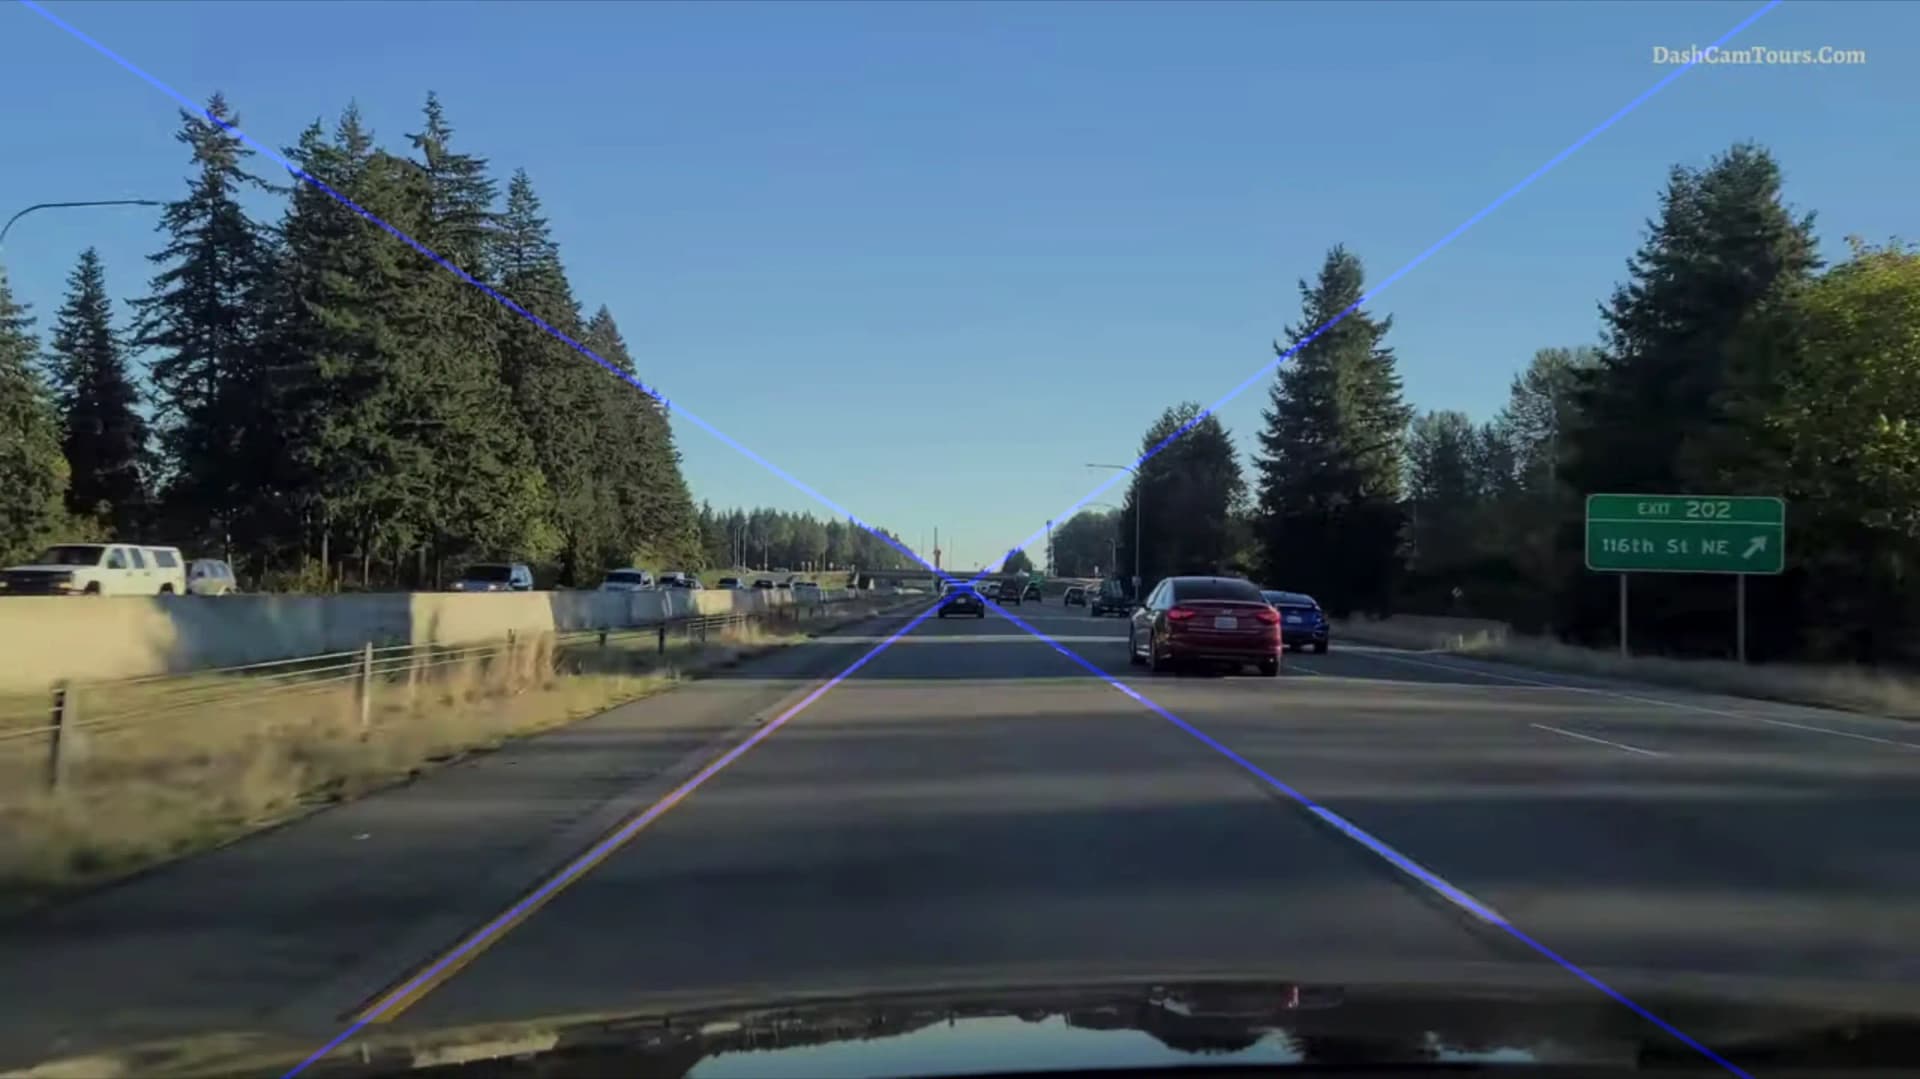
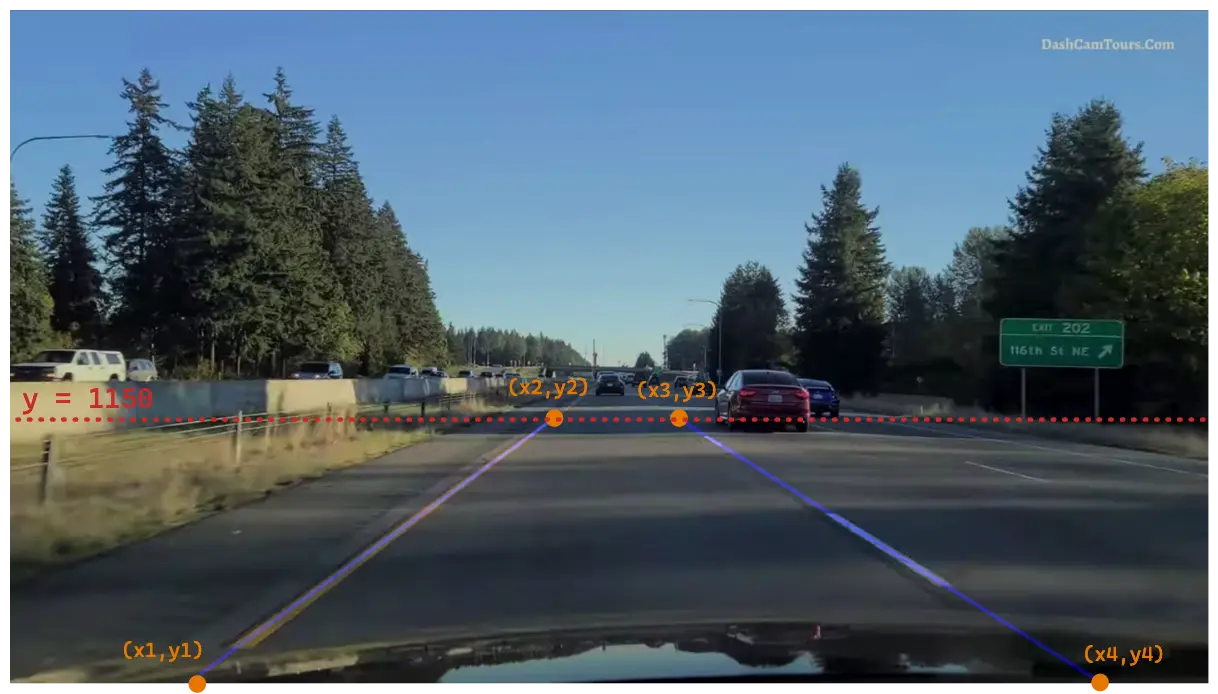
To fix this, we crop the top of the lines to a certain
y value, in this case, 1150. We also crop the bottom of the lines to the bottom of the frame, which has a y value of 2200.# crop the top of the lines so they don't extend too far up
if y2 < 1150:
x2 = int(x2 + (1150-y2) * (x1-x2)/(y1-y2))
y2 = 1150
if y3 < 1150:
x3 = int(x3 + (1150-y3) * (x4-x3)/(y4-y3))
y3 = 1150
# crop the bottom of the lines so they don't extend below the frame
if y1 > 2200:
x1 = int(x1 + (2200-y1) * (x2-x1)/(y2-y1))
y1 = 2200
if y4 > 2200:
x4 = int(x4 + (2200-y4) * (x3-x4)/(y3-y4))
y4 = 2200# crop the top of the lines so they don't extend too far up
if y2 < 1150:
x2 = int(x2 + (1150-y2) * (x1-x2)/(y1-y2))
y2 = 1150
if y3 < 1150:
x3 = int(x3 + (1150-y3) * (x4-x3)/(y4-y3))
y3 = 1150
# crop the bottom of the lines so they don't extend below the frame
if y1 > 2200:
x1 = int(x1 + (2200-y1) * (x2-x1)/(y2-y1))
y1 = 2200
if y4 > 2200:
x4 = int(x4 + (2200-y4) * (x3-x4)/(y3-y4))
y4 = 2200Here we are decreasing the
y value of the top of the lines to 1150 and using the line formula to find the corresponding x value. We are also increasing the y value of the bottom of the lines to 2200 using the same strategy.Here is what the lines look like after cropping:
To draw the lines, we use the
lineline function, which takes the image to draw on, the start and end points, the color, and the line width as arguments.if left_lines is not None:
cv2.line(lanes_image, (x1, y1), (x2, y2), (255, 0, 0), 10)
if right_lines is not None:
cv2.line(lanes_image, (x3, y3), (x4, y4), (255, 0, 0), 10)if left_lines is not None:
cv2.line(lanes_image, (x1, y1), (x2, y2), (255, 0, 0), 10)
if right_lines is not None:
cv2.line(lanes_image, (x3, y3), (x4, y4), (255, 0, 0), 10)Next, we want fill the area between the lines. We use the
fillPolyfillPoly function to draw a polygon using the 4 points we calculated earlier.if left_lines is not None and right_lines is not None:
points = np.array(
[[x1, y1], [x2, y2], [x3, y3], [x4, y4]]).reshape((-1, 1, 2))
cv2.fillPoly(lanes_image, [points], (225, 225, 225))if left_lines is not None and right_lines is not None:
points = np.array(
[[x1, y1], [x2, y2], [x3, y3], [x4, y4]]).reshape((-1, 1, 2))
cv2.fillPoly(lanes_image, [points], (225, 225, 225))Finally, we use the
addWeightedaddWeighted function to add the lanes image on top of the original frame with an opacity of 0.4.frame_with_lane_markings = cv2.addWeighted(
frame, 0.8, lanes_image, 0.4, 0)frame_with_lane_markings = cv2.addWeighted(
frame, 0.8, lanes_image, 0.4, 0)Here is what the final result looks like:
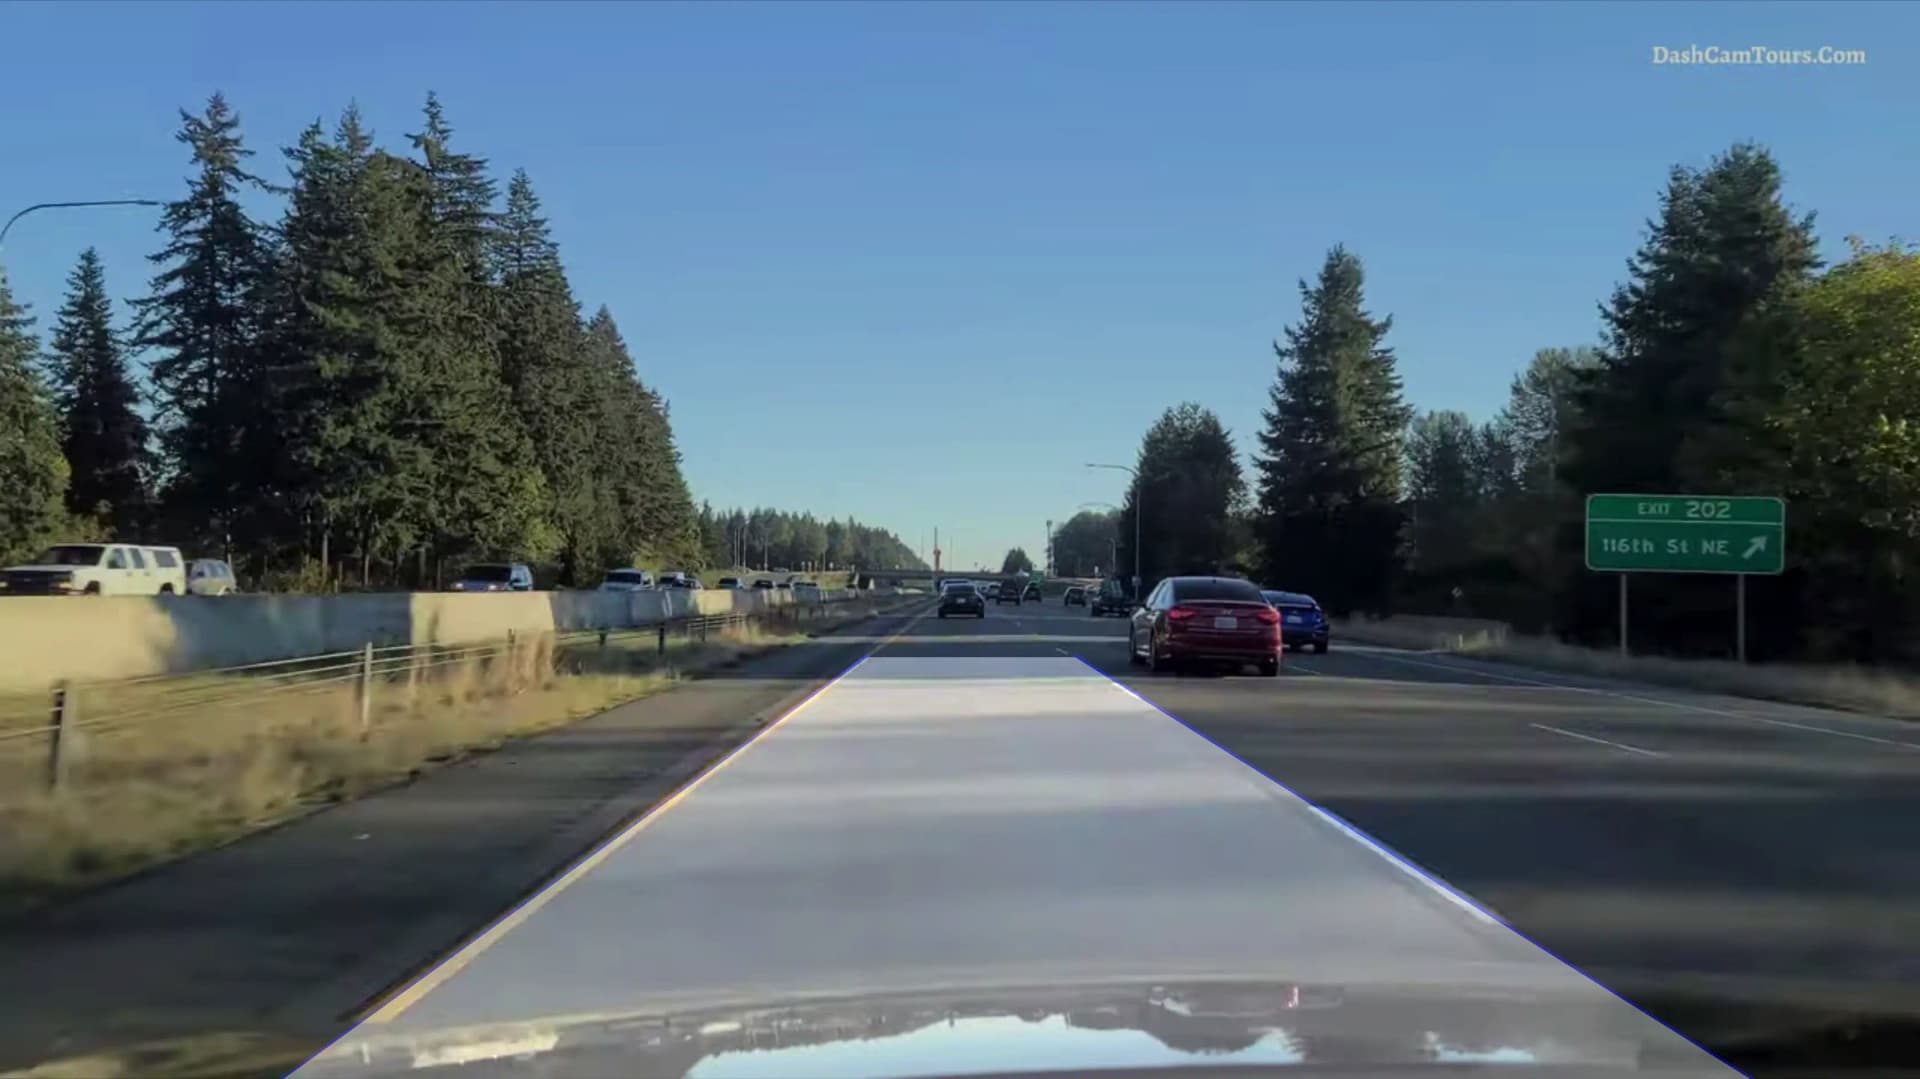
Lane Change Detection
We want to detect when the car is changing lanes, and to which direction.
We know that when the car is changing lanes, the
We know that when the car is changing lanes, the
ρ values of the lines will change. We can take the average left and right ρ values from the previous 60 frames, and compare them to the current ρ values. If the current ρ values are significantly different from the average, we can assume that the car is changing lanes.left_rho_avg = np.average(
[line[0][0] for line in prev_left_lines[-60:]]) if len(prev_left_lines) > 0 else 0
right_rho_avg = np.average(
[line[0][0] for line in prev_right_lanes[-60:]]) if len(prev_right_lanes) > 0 else 0
left_rho_diff = abs(left_rho-left_rho_avg)
right_rho_diff = abs(right_rho-right_rho_avg)left_rho_avg = np.average(
[line[0][0] for line in prev_left_lines[-60:]]) if len(prev_left_lines) > 0 else 0
right_rho_avg = np.average(
[line[0][0] for line in prev_right_lanes[-60:]]) if len(prev_right_lanes) > 0 else 0
left_rho_diff = abs(left_rho-left_rho_avg)
right_rho_diff = abs(right_rho-right_rho_avg)But how can we tell wheter the car is changing lanes to the left or to the right?
We notice that when the car is changing lanes to the left, the
So, we also need to find the average
We notice that when the car is changing lanes to the left, the
x value of the bottom of the left line decreases, and when the car is changing lanes to the right, that value increases.So, we also need to find the average
x value of the bottom of the left line, which we called x1.x1_avg = np.average(
prev_x1_values[-60:]) if len(prev_x1_values) > 0 else 0x1_avg = np.average(
prev_x1_values[-60:]) if len(prev_x1_values) > 0 else 0Now we can detect lane changes and know which direction the car is changing lanes in.
if not lane_change_left and not lane_change_right and len(
            prev_left_lines) > 0 and left_rho_diff > 170 and len(
                prev_right_lanes) > 0 and right_rho_diff > 170:
    # x1 is decreasing when the car is changing lanes to the left
    lane_change_left = x1 < x1_avg
    # x1 is increasing when the car is changing lanes to the right
    lane_change_right = x1 >= x1_avg
    lane_change_frames_shown = 0
    prev_left_lines = []
    prev_right_lanes = []
    prev_x1_values = []
if not lane_change_left and not lane_change_right and len(
prev_left_lines) > 0 and left_rho_diff > 170 and len(
prev_right_lanes) > 0 and right_rho_diff > 170:
# x1 is decreasing when the car is changing lanes to the left
lane_change_left = x1 < x1_avg
# x1 is increasing when the car is changing lanes to the right
lane_change_right = x1 >= x1_avg
lane_change_frames_shown = 0
prev_left_lines = []
prev_right_lanes = []
prev_x1_values = []We use the value
When a lane change is detected, we discard the previous left and right lines and the previous
170 as a threshold for the difference between the current ρ values and the average ρ values. If the difference is greater than 170, we assume that the car is changing lanes.When a lane change is detected, we discard the previous left and right lines and the previous
x values, since they are no longer relevant. Also, we reset the lane_change_frames_shownlane_change_frames_shown variable, which keeps track of how many frames have passed since the message was displayed.Finally, we use the
putTextputText function to display a message for 60 frames when the car is changing lanes.if lane_change_right or lane_change_left:
if lane_change_frames_shown < 60:
cv2.putText(frame, "Lane Change to Left" if lane_change_left else "Lane Change to Right", (1000, 500),
cv2.FONT_HERSHEY_SIMPLEX, 4, (0, 0, 0), 8)
lane_change_frames_shown += 1
else:
lane_change_left = False
lane_change_right = False
lane_change_frames_shown = 0if lane_change_right or lane_change_left:
if lane_change_frames_shown < 60:
cv2.putText(frame, "Lane Change to Left" if lane_change_left else "Lane Change to Right", (1000, 500),
cv2.FONT_HERSHEY_SIMPLEX, 4, (0, 0, 0), 8)
lane_change_frames_shown += 1
else:
lane_change_left = False
lane_change_right = False
lane_change_frames_shown = 0